Real Time Search
The visualisation presented on this post represents a new way of visualizing Real-Time Search, focused specifically on the user and not only on the query. In this case, we are using dummy data to represent the journey of each user through Search. Of course, this is just a Proof of Concept, and the next step is to build a Real-Time visualisation showing all the information of this journey: queries made by each user, products clicked at every moment, performance indicators involved, etc. But let’s talk about the motivation to create this visualisation…
Data analytics in terms of eCommerce Search is an essential tool for decision making, since it allows us to study the information from the past and obtain conclusions to improve the product for the future: a concise analysis and presented in the right way to the decision makers is a determining aspect when it comes to evolve Search. At Empathy we are aware of this and, as can be seen in previous posts of ImagineYourData, one of our objectives is to materialize this premise.
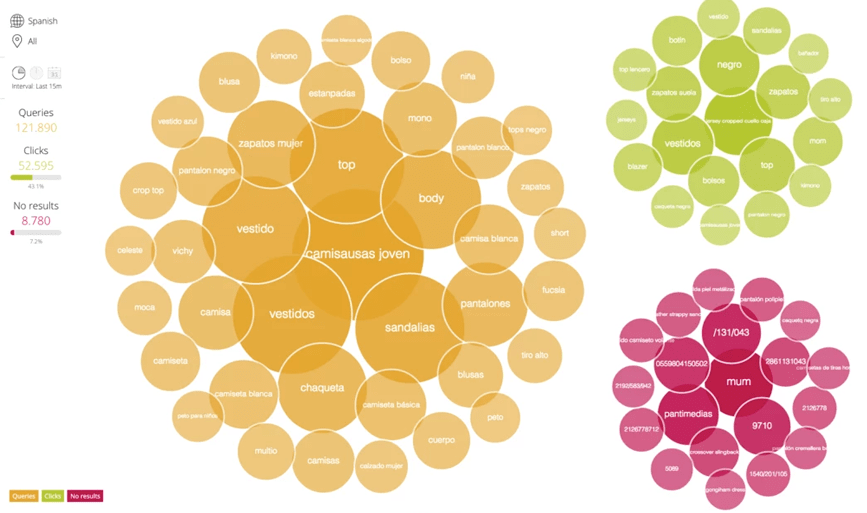
But not every analysis should be based on data from the past, and monitoring in real time is an example of that. Real-Time allows us to analyse the present and anticipate to the needs of the users as they are presented on screen. The best proof of this is our Empathy Now, a visualisation that represents the most important stats related to queries.

At Empathy we believe that it is key to evolve the analysis from the query to the user, in order to take into account all the aspects that exist around them, and not only the query they do. Add Comment
