


Search Intelligence Performance Measurement
Context is a customisation system that stores behavioural patterns, so that the searches suit the client’s tastes and preferences within a trustworthy experience. In other words, we provide contextual relevancy models that respect consumers’ privacy through a truly anonymised experience.
To that end, through Context Empathy develops dynamic relevance models that personalize search results based on the different contexts surrounding a query:
Query Context: We analyze the interactions of all users with a query, to develop a generic relevance model for each query.
Category Context: We analyze the general navigation of users to generate models that determine a score for the products of a category.
The objective of Context is to improve the positioning of the products so that people find what they are looking for easily. Context thus increases the level of interaction with the search as well as enhance the relationship between customers and the brand’s page.
If we try to improve the positioning of the products, it is logical to expect reduced effort by users to find what they want and therefore, the number of clicks on pages other than the first one will have to decrease.
With all this information, we start from the idea that the volume of clicks and their position will be the key to measuring the performance of the Context feature.
Quality experience metrics
Thanks to the metrics available on Empathy Playboard, we selected a series of initial KPIs that we used to begin the design of the Context KPIs:
a. Queries- Number of queries performed.
b. CTR (volume) - Number of total clicks
c. Findability (volume) - Number of clicks on first page
Once we have the base to begin our analysis, we have to think about the correct data aggregation to verify the performance of the service. In this case, the algorithm improves the positioning of the products shown by a query, therefore, we decided to aggregate the data by search terms.
With the aim of checking the distance between Findability and CTR and seeing its performance in a particular period of time, we have created the Quality Experience Distance (QED). This KPI tries to give us an idea of the distance that exists to reach optimal browsing experience, the one in which people perform a search and, in the first positions, products appear that capture users’ attention and encourage them to interact.
We will calculate the QED in this way:

CTR =Number of Clicks / Number of Queries*100
FINDABILITY =Number of Click on first page / Number of Queries*100
QED = CTR - FINDABILITY =Number of clicks on pages other than first / Number of Queries*100
That is, the quality experience distance tells us what is the proportion of queries that end with a click on a page other than first.
In a utopian situation, this parameter could tend to zero; this happens when the Findability is equal to the number of queries, that is, all the queries made end with a click on the first page. With this metric, we do not intend to achieve a utopian value when we check the performance of our services, but we want to verify if our services effectively improve this positioning and reduce the distance to the optimal experience.
Continuing with the previous approach and since not all queries translate into clicks, we thought that it’s interesting to analyze only clicks to determine their composition, obtaining the Quality Experience Rates (QER and B-QER):

How to measure Context impact
Once we have identified the most interesting KPIs to measure performance, we focus on the process to check whether the Context service has worked.
We begin this analysis process by selecting two sets of queries with which to compare the before-and-after Context:
- Top 100 queries. We will select the 100 queries with the highest volume of searches. These are the most relevant queries for clients, however, they do not have a wide margin for improvement, because in general the results offered by these queries are usually good.
- Top Context queries. We select the set of queries where Context has a wider margin for improvement, these will be those with:
- High CTR. Queries that show products of interest to users.
- Low Findability. The relevant products of these queries are placed on any page that is not the first.
These queries, therefore, are of interest to users, but users must make a greater search effort to find what they are looking for.
Once we have the queries that we are going to analyze, we will have to collect data from the period prior to Context and the data obtained after the start of Context and compare the obtained KPIs. Now we know the KPIs and the sets of queries to analyze, so we can start to analyze the Context impact.
QUERIES PERFORMANCE
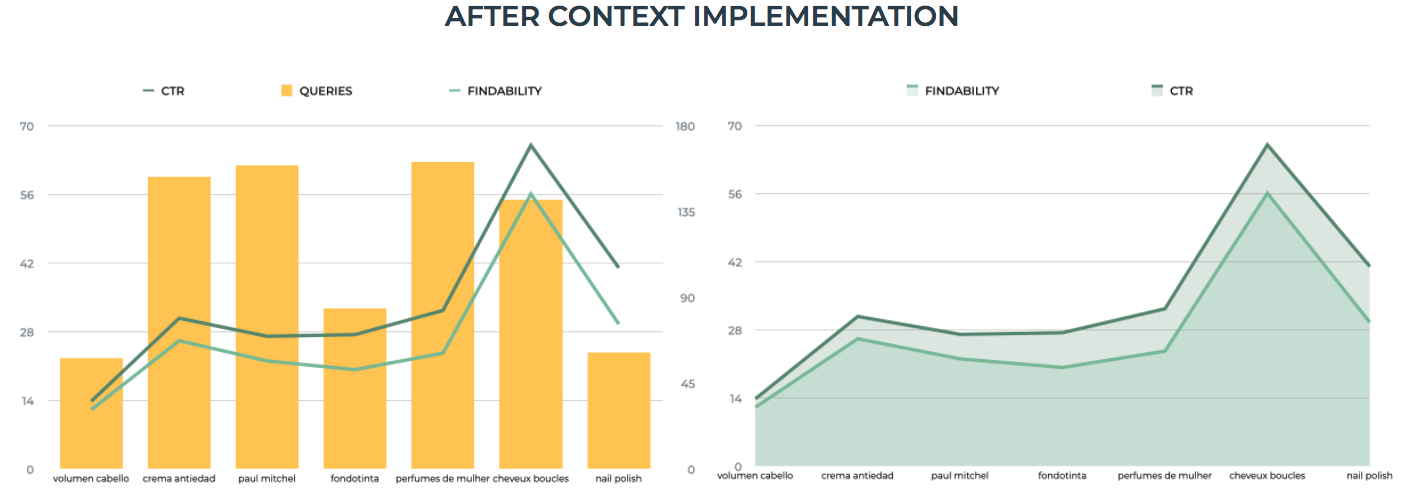
The following charts show how the Quality Experience Distance evolves. The first chart below is composed of a bar graph (representing the volume of queries for each term associated to it) and two line graphs representing the CTR and Findability of each of those terms. In the second chart, CTR and Findability are presented in a more visual way, excluding the query volume to easily appreciate how CTR and Findability were acting before Context implementation.
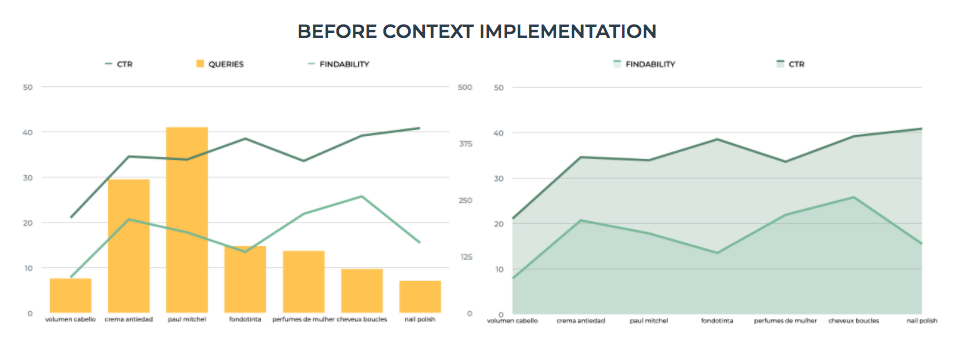
In the graphs before Context, we see that there is a considerable distance between CTR and Findability even in some of the queries such as 'fondotinta' or 'nail polish', the trends between both metrics are opposite. The greater the distance between these metrics, the greater the number of clicks made on pages other than 1, which indicates that people are making a greater effort to find those products that are of interest to them.
We also extract some quantitative analysis with interesting insight:
- CTR has grown 2.95% after the Context implementation; this indicates that the products shown by the search engine arouse more interest in the people who make these queries.
- Findability and Quality Experience Distance corroborate the improvement caused by Context. Not only does CTR increase, but also the clicks on first page (Findability). This shows how the products displayed by the analysed queries are more relevant to customers and, consequently, users make less effort in finding - and clicking - on the desired products.
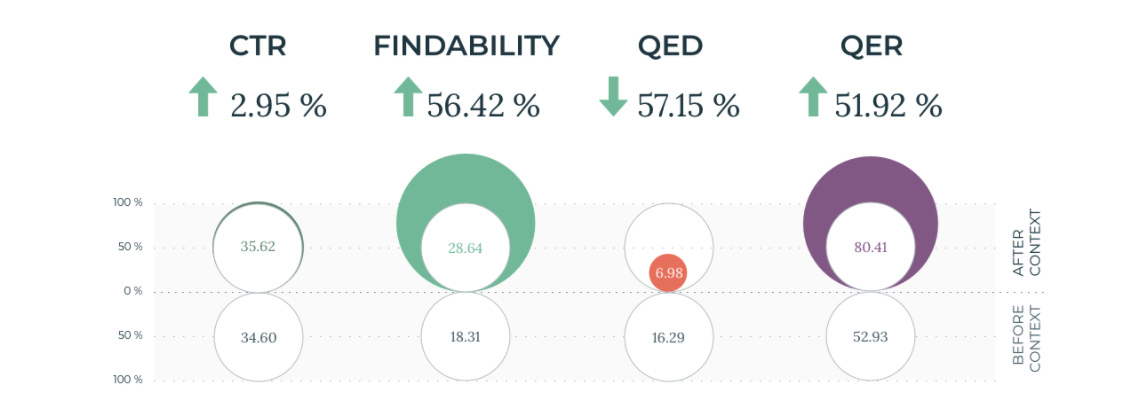
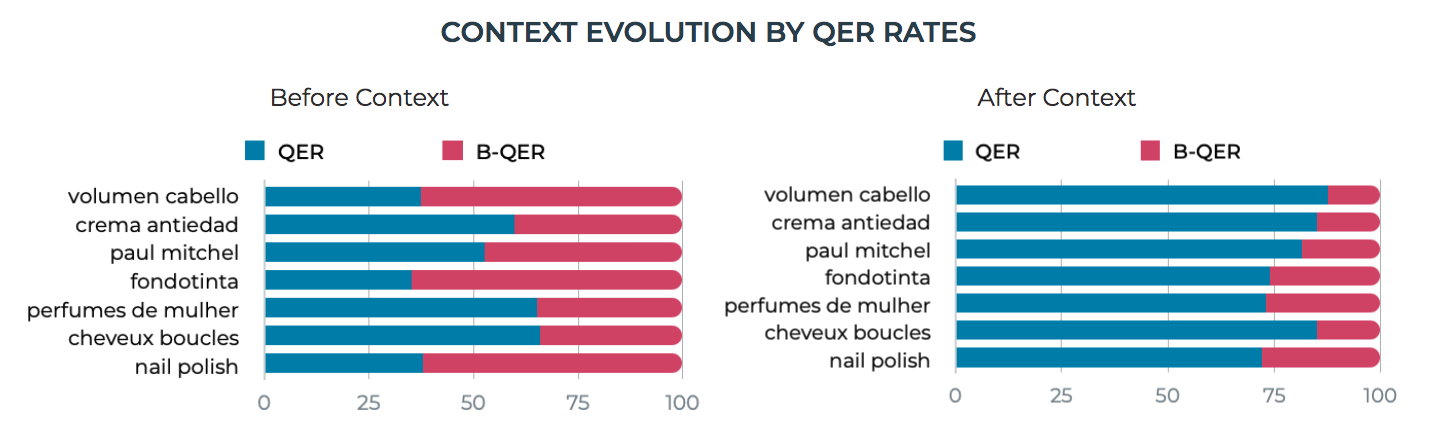
When analyzing the Quality Experience Rates (Quality and B-Quality), these metrics give us a little more information on Context's performance. If we observe the two graphs below, it is evident that the percentage of clicks on the first page (QER) of all the terms after Context implementation is higher, going from an average of 53% before Context, to 80% after it.
GLOBAL SEARCH PERFORMANCE
Now we are going to analyze how Context has influenced the performance of the search experience in general terms.
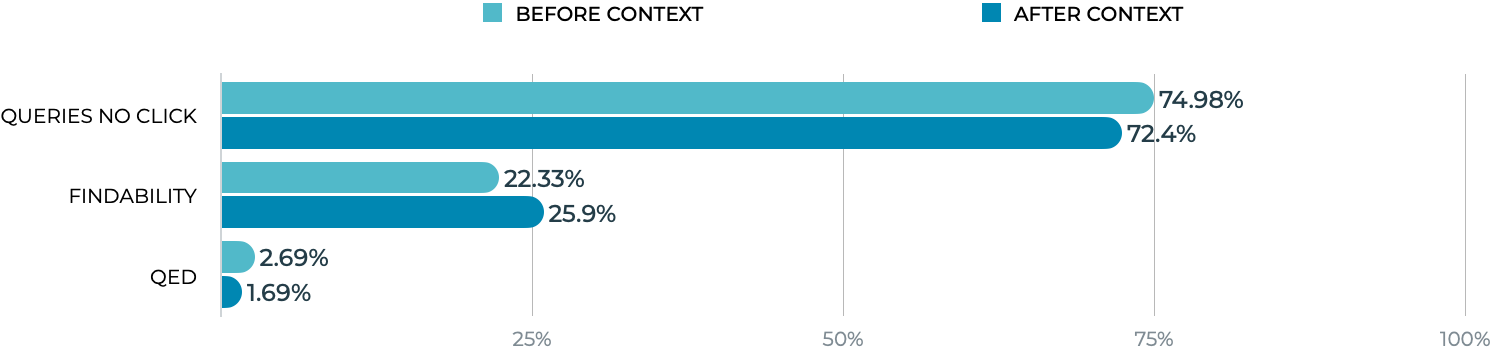
With this chart, we see the evolution of queries without clicks, with clicks on first page and clicks on other pages. In this case, we can see how the set of queries without clicks decreases, which implies a growth in CTR that is given by a growth in Findability. In other words, after the start of Context, the proportion of queries that end in a click increases and most of these clicks occur on the first page.

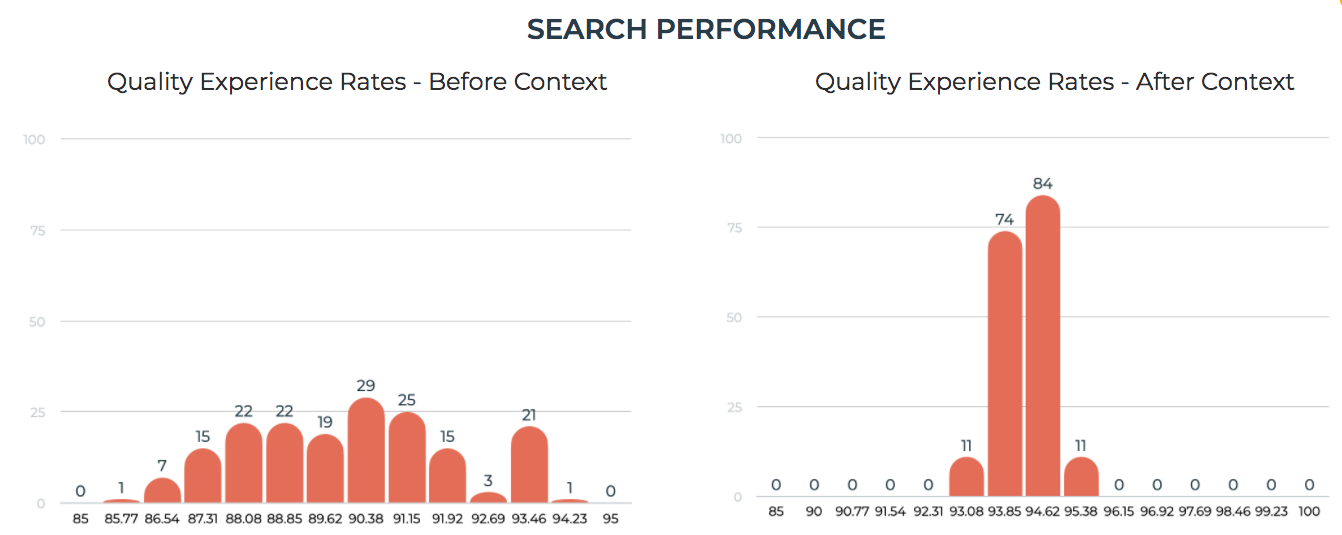
The above histograms represent the Quality Experience Rate before and after Context. The difference between both graphs is clear, on the left, we have the period before Context, where the QER has an average of 89.68% and a lot of variability in the data, reflecting values between 85% and 95%. On the right, we have the graph after Context, in which the data presents a distribution much more similar to the normal one, with a higher mean QER (93.87%) and a much lower variability, taking values between 92% and 96%.
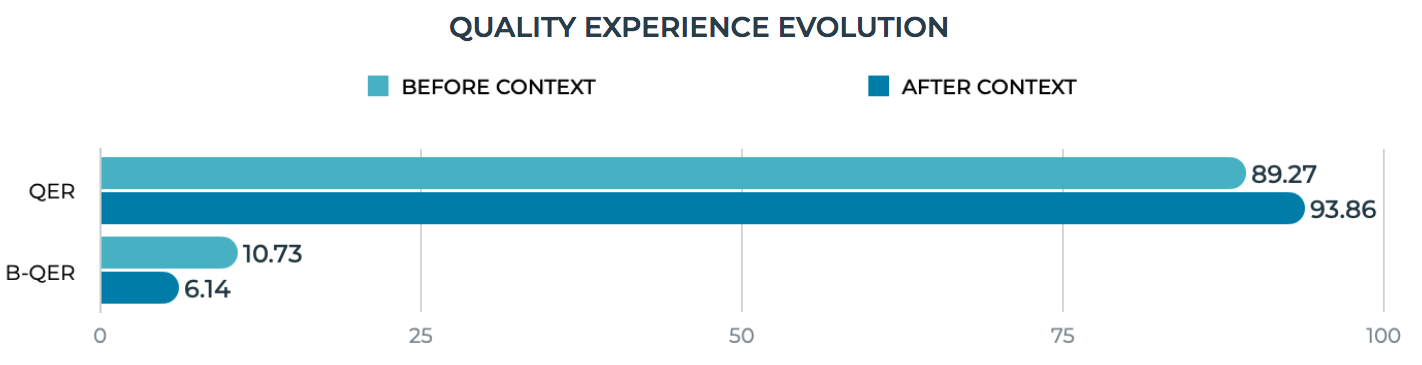
When analysing the two quality rates, we can see a change in the variables after context. We see in the chart how the percentage of clicks on pages other than 1 decreases by almost half. With this we can infer that Context has improved the performance of the search engine, making the search engine generally position the products in a more efficient way, encouraging users’ interaction.
To conclude, we can also check how Context has affected the Add to Cart rate(A2C). Below we see the histograms of the variable Add to Cart (% of queries that end in A2C), as was the case with the percentage of clicks on the first page, the distribution of this variable is normalized after the start of Context. If we have a look at the graph, it is observed how the mean of A2C after Context increases and the variability in the data decreases.
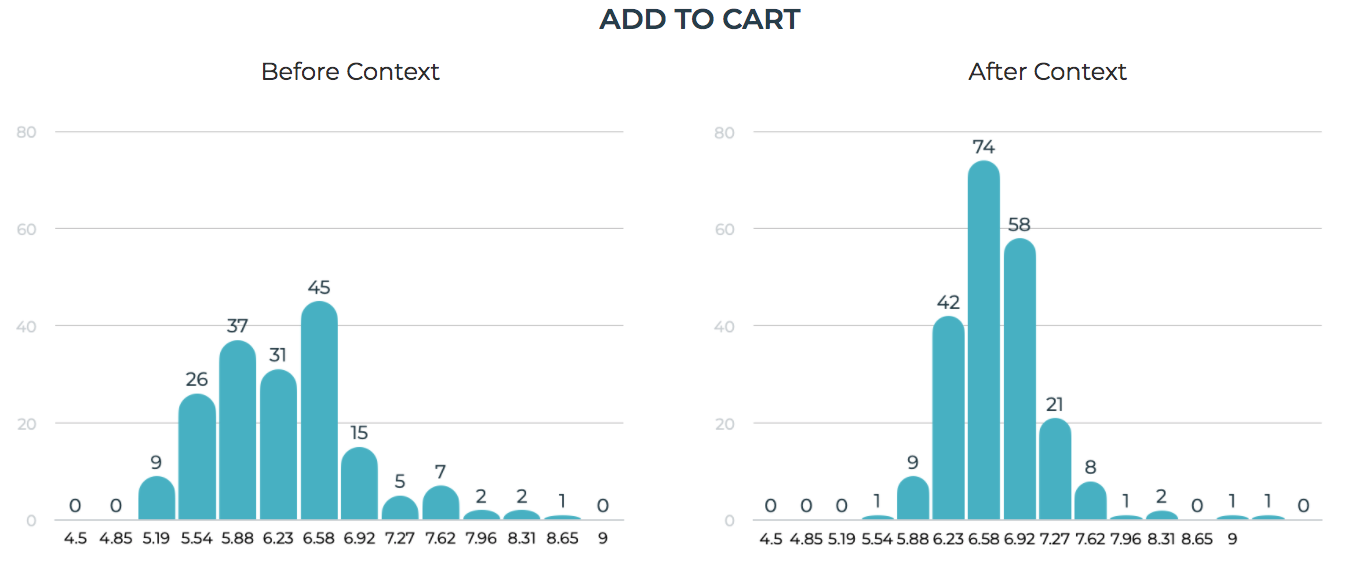
Logically, this new distribution affects the mean of the variable before and after Context, going from 5.95% to 6.97%. This growth reflects how the improvement in search engine performance thanks to Context translates into a greater possibility of acquiring a product on the page.
CONCLUSIONS
With the insights presented in this analysis, we determine how Empathy Context improves the positioning of the products shown on the results page by the search engine, increasing the relevance of the results. This positively affects the whole search and navigation experience of people when they navigate, helping consumers find what they are looking for more easily and allowing them to invest less search effort for it. In addition, it can be concluded that this improvement in the quality of the experience has, in turn, a positive effect on the purchase intention.
Check out this case study for more details about Context feature.
