Measure Your Users’ Flow

Most e-commerce and online platforms track different metrics that measure users’ general behaviour on their websites.Due to these different approaches, the industry lacks consistent knowledge about theintention of users’ journeys and transactions; we therefore struggle to obtain insights about how to encourage shoppers to repeat the behaviour that led to the purchase.
If we want to make our shoppers feel happy on our page, and consequently increase purchases, we have to endeavor to understand how they feel and make their navigations as easy and comfortable as we can. We must empathize with them. We do this the same way that businesses focus their efforts on improving the shopping experience in physical stores: personalized treatment, product overviews, accessible catalogue…
If we do not pay attention to what our brick-and-mortar consumers mean and we consider them as mere numbers, how are we going to do the same in the online environment?
THE FLOW THEORY
Wanting to know how users feel, takes us to the field of psychology, in particular, the Flow Theory. The Flow is a state of mind that people experience when they feel a total involvement with what they are doing, when they feel focused and have fun.
Studying this theory, we get different metrics that explain the engagement and Flow level of the users. With these metrics, we can cluster the users to study their satisfaction with the page. One we have done the segmentation, we can analyse the behaviour of the different groups to focus on their specific needs and to be able to encourage all users to search and navigate with optimal satisfaction.
THE RESULTS
We form three groups based on the users’ level of engagement or Flow (Low, Medium and High). Then, we study the behaviour of the different groups according to three different variable blocks.
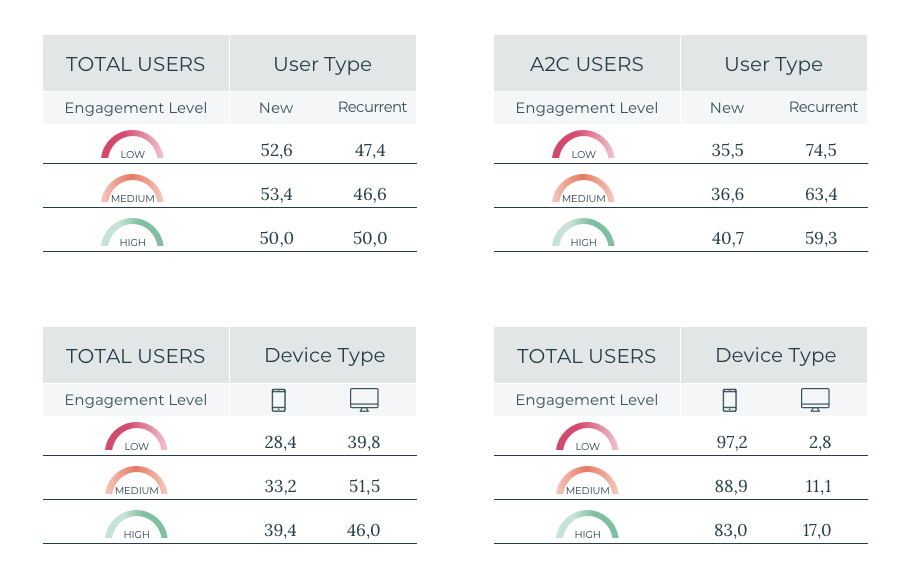
In this block, we have different metrics that show us the engagement of the groups. First of all, we show the percentage of each type of user (new and recurrent) and the percentage of each device or scope (mobile, app, desktop...) and the differences between the total users and the users that make an Add to Cart (A2C) event.
User and device types
As a first indicator, we must see which of the groups has a higher percentage of recurrent users; the higher this percentage is, the higher the satisfaction of the users that make up the group.
On the other hand, Flow theory tells us about perception of safety and its influence on the mental state of users. In this case, we know that the computer is the device that transmits greater security to users, therefore, the greater the percentage of users who use this device, the greater the predisposition to reach this mental state. We can see that, in this case, the cluster offers us the expected results, with users with a high level of engagement being those with a higher percentage of recurrent users who use the computer, and they are also the group with a higher percentage of users who perform A2C.
It is also interesting to study the percentage of users who perform A2C and what kinds of user trigger these events. In this case, the highly engaged users are more confident on the page; they are the highest percentage of new users making A2C and the highest percentage of users who perform A2C with a device distinct from a desktop.

- Numeric engagement variables
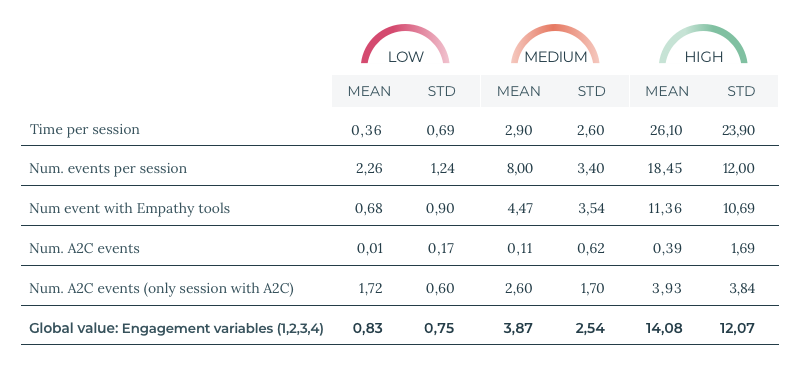
On the other hand, we have numerical variables that indicate the level of engagement of the users’ group. The higher the value of the groups in these metrics, the higher user’s engagement level. And therefore, the greater the predisposition of the users of the group to come into the Flow state.
As might be expected, the group with the highest engagement is the one with the highest values in these metrics, being the users who carry out a greater number of events or longer sessions, who carry out the greatest number of events aided with the Empathy search tools. In addition to being the group with the highest proportion of sessions with A2C, they are also the group where the greatest number of A2C events takes place per session.

- Variables on the purpose of the visit
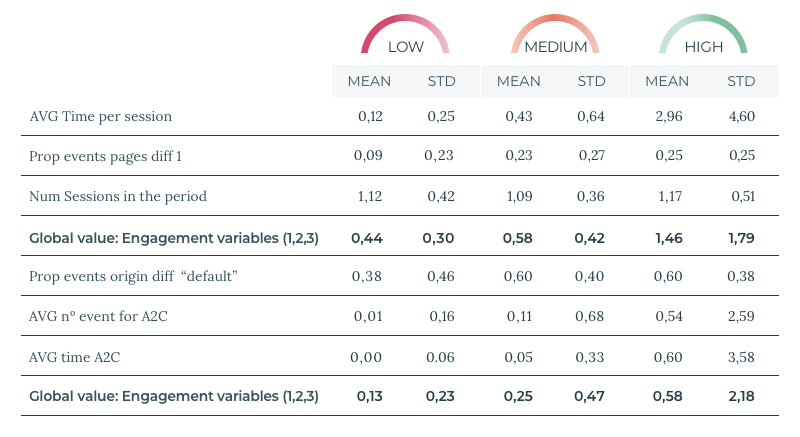
We divide this block of variables between the metrics that indicate the motivation of the users and the metrics that tell us about the effort of the users on the page.
- Motivation
According to Flow theory, there are two types of motivations when carrying out an activity. On one hand, we have the intrinsic motivation, which occurs when the activity is carried out without having a specific objective. On the other hand, we have the extrinsic motivation that occurs when the activity is carried out to meet a specific objective.
We can think of intrinsic motivation when a user enters the page without a clear idea of what to buy, when the user only wants to know the news of the page or explore the products. On the other hand, extrinsic motivation will occur when a user has a specific product that they want to purchase and for this reason, they will feel apathetic with the page if it does not return the expected results in the initial interactions.
High values in these metrics will indicate that the sessions are motivated by the pleasure of browsing the page (intrinsic) and not by wanting to purchase a specific product (extrinsic).
- Effort
These metrics help us to corroborate the type of motivation that leads users to navigate the page. In this case, users with intrinsic motivation are those who make the greatest effort in browsing.
In this sense, the flow theory tells us that when a person performs an activity out of intrinsic motivation, they will have a greater chance of entering a state of Flow. We can see how users with a higher engagement level are those who do not have a specific objective on the page (intrinsic motivation) and make a greater effort through search and navigation on the web page.

- Navigation Variables
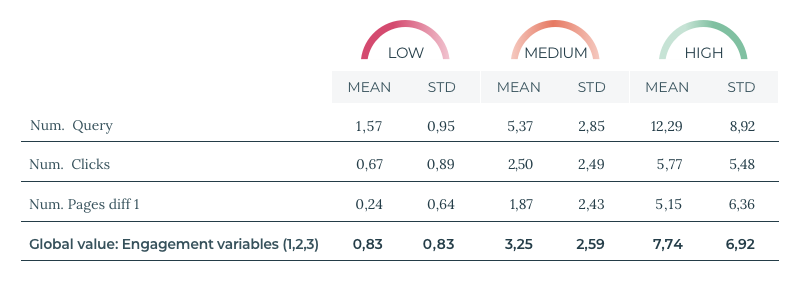
Finally, we have a group of variables that tell us about the users’ behaviour when they browse, the number of each type of event carried out and the number of these events occur after the first page of search results.

We use this block of variables to study how users behave when browsing. In this case, we can see how there are a greater number of queries than clicks and that the higher the users' engagement, the greater the number of events on pages other than search-results page one.

CONCLUSIONS
- In the high engagement group, we discover the shoppers with the highest intent to purchase, highest feeling of security, and highest motivation to explore the product catalogue for unplanned purchases. This group enjoys the site most, and is most likely to return.
- In contrast, with the fewest A2Cs, the low engagement group shows the least intention to buy. Their interaction with us is concise, leaving no time for discovery. Flow theory tells us that they will feel frustrated if don’t reach their goal swiftly.
- It is the medium engagement group that offers the greatest opportunity for increased sales. The group’s intermediate involvement offers great possibilities for reviewing shoppers’ flow attraction in terms of intent, engagement and interaction with the site. Ecommerce managers and merchandisers prioritize this group for conversion into loyal and repeat visitors who move into the high engagement group.
If you want to know more about how search analytics help us understand our customers and segment their intentions, check out this paper. Let’s make online consumers have fun, feel understood, and get into the Flow!
