


Creating the New Empathy Alert System
As the online retail market continues to grow along with consumers expectations, the industry has become more and more data driven and metric obsessed.It’s especially important in today’s ever more ferocious and competitive multinational marketplace. Top notch performance is pivotal and faults, albeit temporary, can cause permanent damage with a loss of reputation, trust and revenue.
Our EmpathyInsights captures data from our search and navigation engine which can categorise, filter and match millions of queries in a day to not only keep an eye on the vast amounts of streaming data but to help retailers unleash the value of large data sets. This enables them to enhance and tailor customer experiences, make more informed buying and design decisions, anticipate trends and detect opportunities as well as inspiring ideas and creativity.
We wanted to drill down further into this data and help our customers by creating a new Empathy Alert System. A system built around two principal needs:
-Pattern Prediction: To understand and forecast what’s coming based on consumer behaviour to give customers real-time information when they want it.
-Anomaly Detection: To be able to proactively recognise any abnormalities as timely detection enables us to protect and advise our clients.
We determined several key factors that we wanted to analyse and detect, with the main two being:
-Findability: This is our measurement for search success, and is a set of formulae developed in-house through collaboration between our maths and tech teams.
-Queries: We wanted to know what’s being typed in the search box. Whether consisting of one or multiple words.
Pattern prediction
The idea here is to be able to look into product trends and behaviour during a one year cycle. As an example, the graph below shows the amount of queries for fascinators in the UK in 2017 and 2018 for one of our high-street retailer clients.
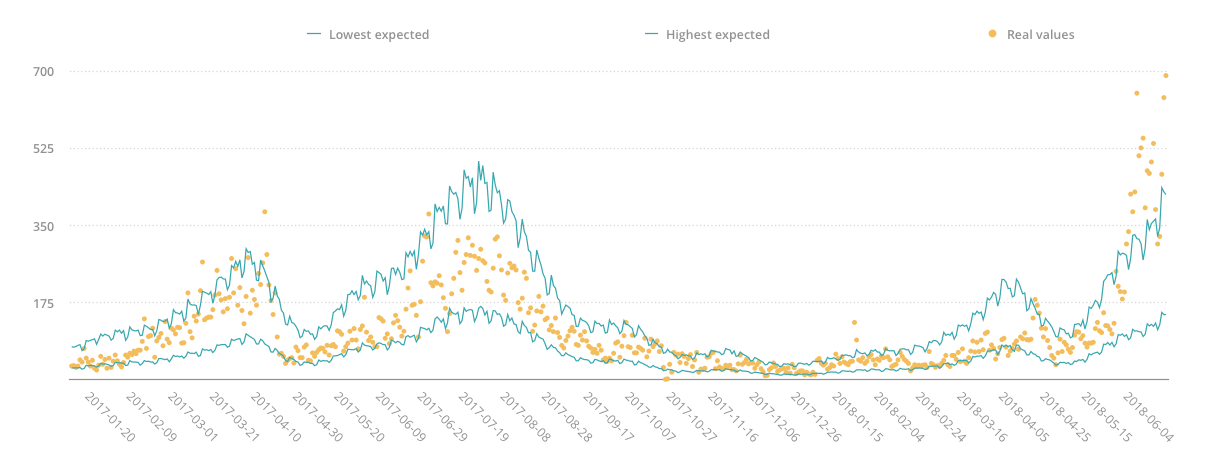

The blue outer lines represent the maximum and minimum expected queries with the yellow dots showing the amount of real queries. As fascinators are often wedding items, we can see that their popularity increases in Spring and Summer, the typical wedding season. What’s also really interesting is if we look at May 2018, on the far right of the graph, we can see an extraordinarily high peak that goes way above expectations. Any ideas? Well maybe a certain Royal Wedding.
The graph shows this trend and the unexpected amount of queries in May 18 as an anomaly, triggering a real-time alert to highlight the phenomenon.
So why is this relevant?
Well by discovering something new in the data, spotting new trends or understanding real-time customer behaviours means that we’re able to alert our clients so they can make better informed decisions and enhance the customer experience. As well as, in the example above, taking advantage of a breaking trend through increasing stock levels, offering sales incentives etc.
Some trends might not be foreseeable, and this prediction algorithm allows us to detect, highlight and study exceptional behaviours or occurrences across millions of products to bring our attention to the unexpected and the extraordinary.
Anomaly detection
This algorithm analyses a range of measures of success to find events that are out of place. It’s different from pattern prediction because findability has no pattern.
The graph below shows findability in blue and queries in yellow. We can see that there is a dip in findability towards the end of March which, while only less than 2% of the value, is enough to have an impact on a client’s revenue so it’s important to be able to detect it and deal with it ASAP.
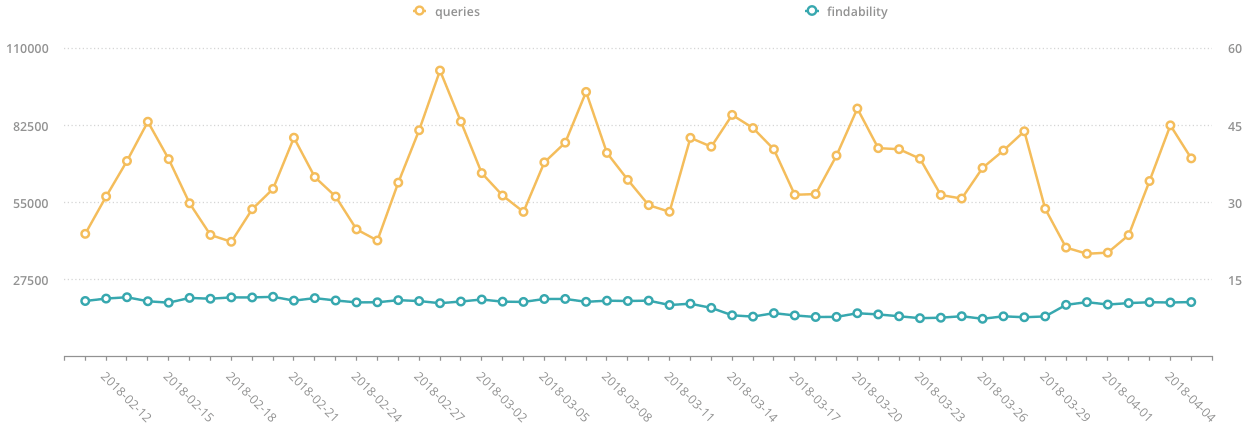
As findability is random, the model needs to be able to use a dynamic algorithm that constantly studies overall behaviour to decide what is normal and what is extraordinary.
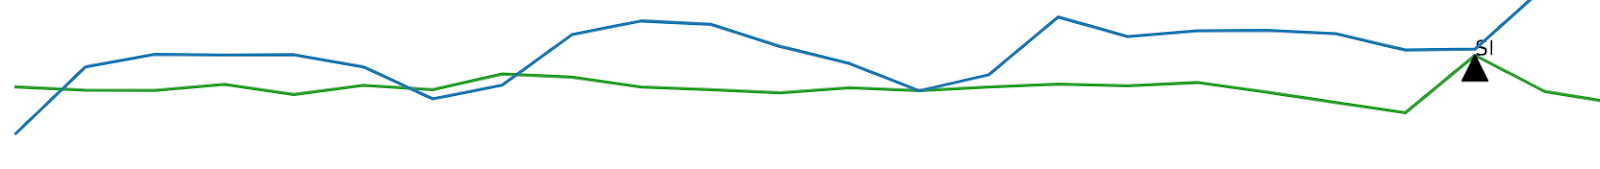
The following snapshot depicts how our alert system sees findability (in green) and reports on extraordinary happenings (the triangles), while the queries are in blue.
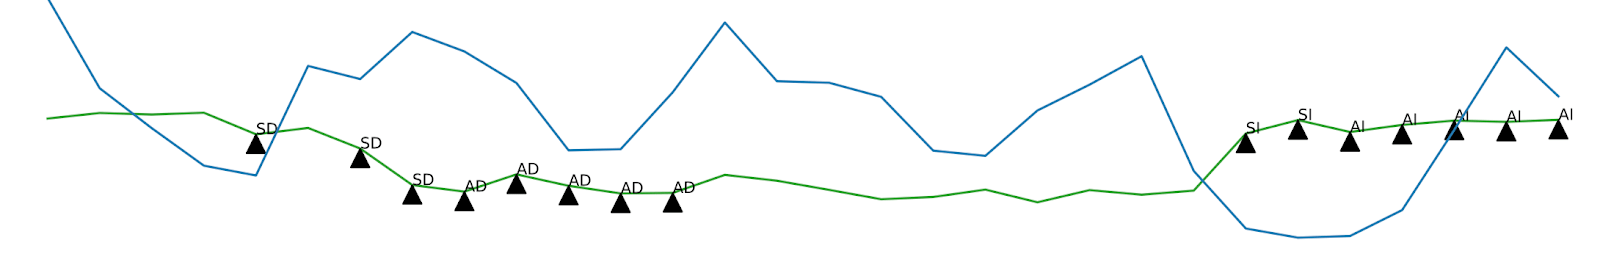
On the left, the decrease is very gradual, but it is still detected. The algorithm sees three dips (SD) and reports on the findability dip, it then stabilises below normal (AD). After a while it assumes this is the new normal and stops the alert. On the right, we can see that findability is restored in two steps (SI), and the system reports that findability is stable, but higher than the previously considered normal, creating a new normal (AI).
What’s more, as findability fluctuates differently from client to client, it’s key that the algorithm can recognise normality in context.
Let’s take a deeper dive into the Algorithms.
Pattern Prediction
Queries follow trends which we can deconstruct into the following four behaviours:
1.Growth, which in our case is modelled as an exponential function to anticipate the potentially explosive growth of IT businesses.
2.Cyclical trends, which can be of weekly and yearly frequency (e.g. Saturdays or Valentine’s day)
3.Isolated events, which we do not expect to see repeated at equal intervals and therefore need to be isolated from the final trend (e.g. The Royal Wedding, TV ads)
4.Noise, which is random and unforeseeable, but still needs to be measured and graphed.
These variables are all modelled separately and then put together in a single equation that produces a graph like the following one:
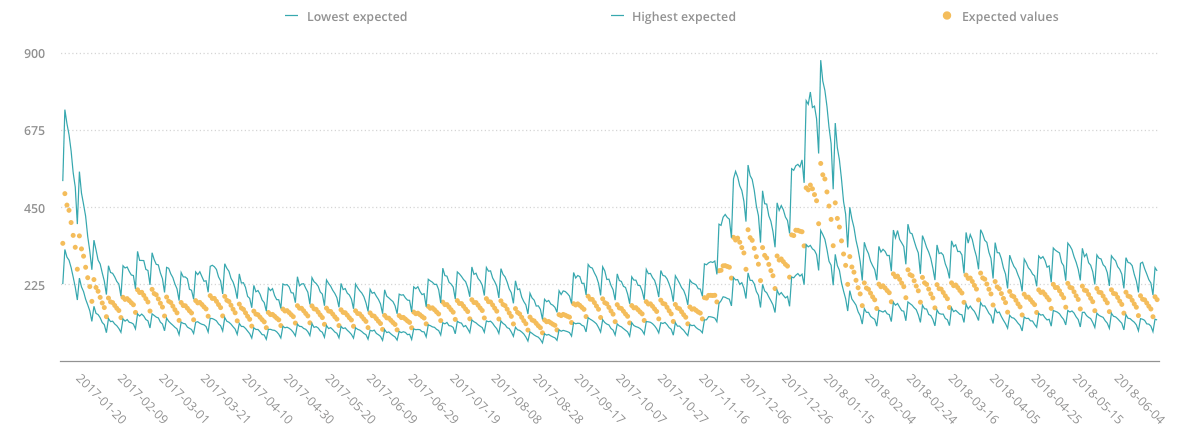
Above, we’re looking at the query headphones from 2017 to date on one of our eCommerce clients. While it shows that people buy headphones all year round, we can see that they are most popular during Black Friday, perhaps not so surprising, and in January. Why do you think that is? Something to do with those New Year resolutions and headphones usage at the gym perhaps!?
Anomaly detection
This algorithm contains a set of variables that track changes in different statistical aspects of the data. Let’s take a look at what we mean by this and how this works.
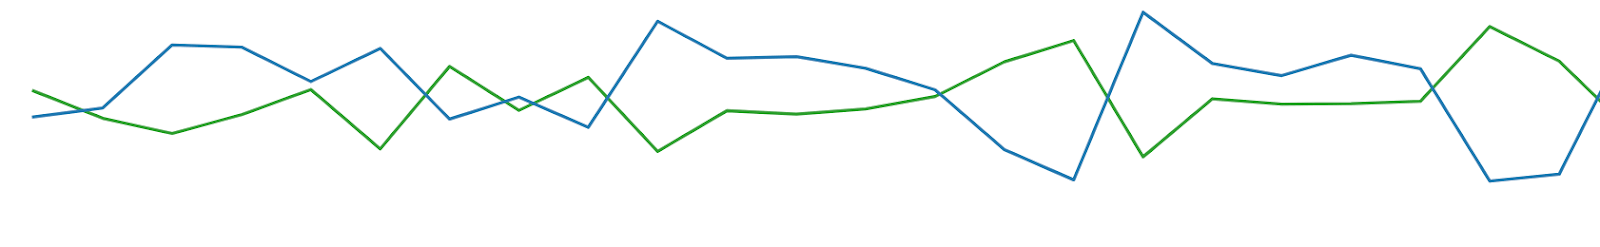
The above green line shows a constant flow of unstable signals and therefore each one is treated as normal by the algorithm; nothing is out of the ordinary here.
This green line however shows a very stable signal, so the variation of an unstable signal stands out and the algorithm picks up that something’s not right, and an alert would be sent for further investigation.
Of course, not all alerts represent problems, some can also be opportunities to study what went well on a particularly good day which may not have spotted without an alert system.
Conclusion
We’ve been able to develop a really powerful tool to track millions of customer queries and behaviours, a feat impossible to do using the human eye alone. It means that our data team are able to quickly spot and fix possible disruptions, discover new behaviours and uncover potential opportunities.
Machine Learning is allowing our computers do what they do best so we have more time to do what we love: understanding, empathising, creating and providing amazing and joyful online shopping customer experiences.
