


On Hierarchy and Data Visualisation
Finding a product within a catalogue could come through many search options. However, by changing this perspective and tracing back the path used to find a particular product, you can provide valuable information. It allows you to understand how to enhance specific search paths that might otherwise have been overlooked.
Putting the product at the top creates a hierarchical distribution of these different paths with their ramifications. Visualising hierarchical structures is a traditional challenge, as it is necessary to display them in an intuitive yet detailed fashion.
At Empathy.co, we explore the basic concept of hierarchical distributions from its theoretical visual perspective. We start by evaluating different approaches on how to depict hierarchy, to identify advantages and disadvantages of each distribution.
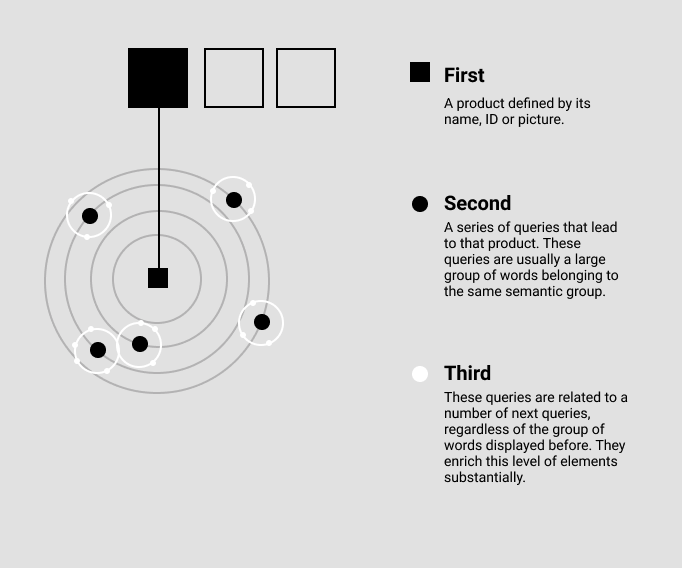
In this specific example, our aim is to represent the queries and the associated next queries that take us to a product. We therefore define three levels of hierarchy: the product is on top, then queries and associated next queries on the second and third levels respectively.
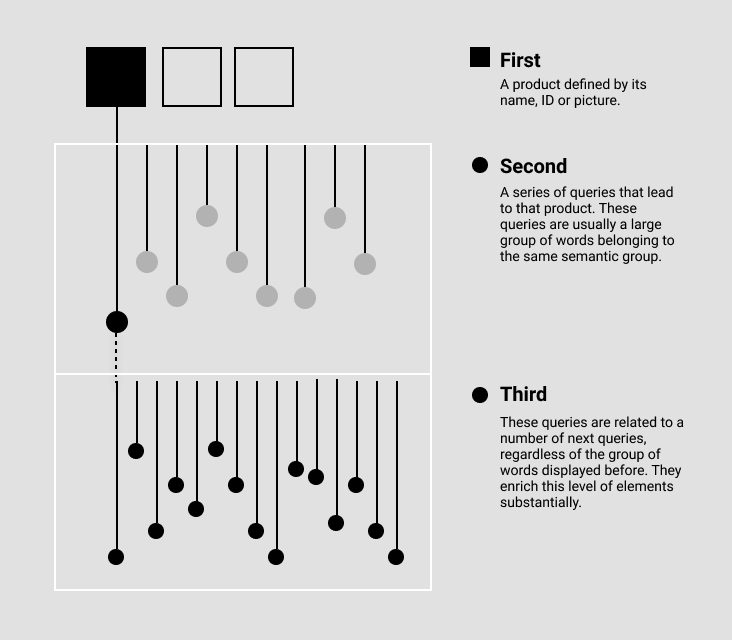
Dots
A linear distribution of dots would define precisely each one of the queries leading to a particular product. Products themselves are displayed on top, while queries and next queries hang from these products sequentially. Despite the advantage of an intuitive linear representation, space is not optimised when there are many queries and next queries.
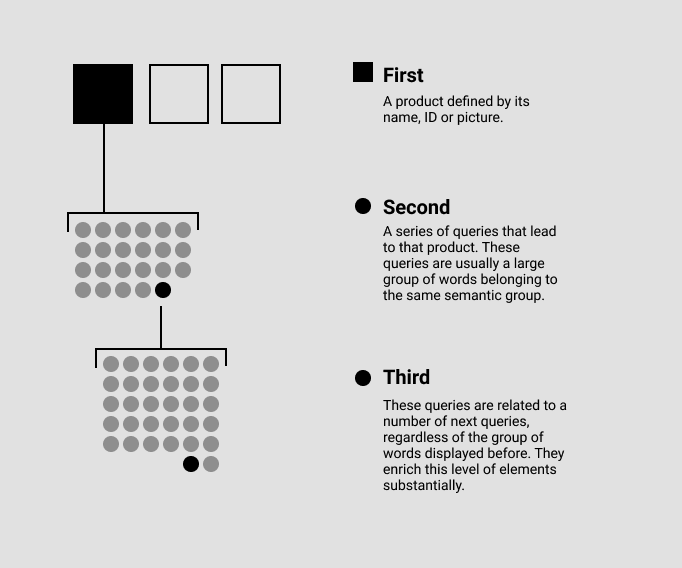
Stacked Dots
The space optimisation could be resolved using a compact distribution of elements, such as these stacked dots. This distribution allows you to see all at just a glance, with some degree of interactivity to display the next queries. However, this is already a classic visualisation technique that could be revisited to create something new.
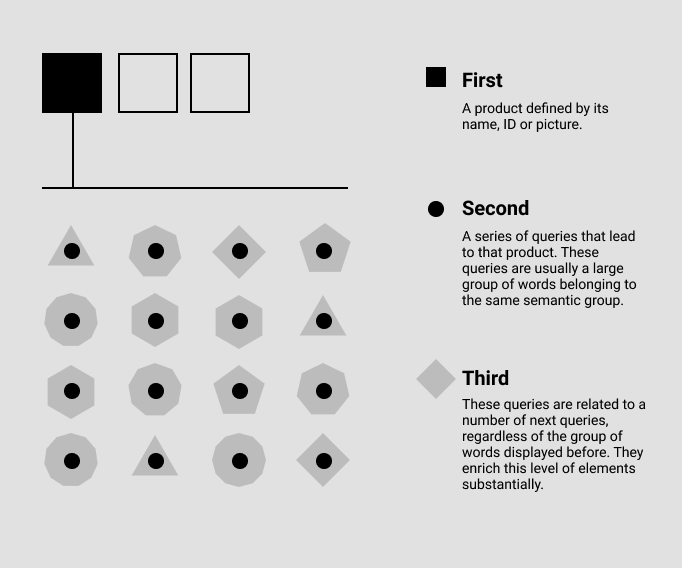
Polygons
A completely different approach could be using polygons. While queries could be displayed as stacked dots, their associated next queries could be represented as the number of vertices of polygons surrounding the queries. These diamonds would directly show the constellation that relates the second and third levels of hierarchy.
Orbits
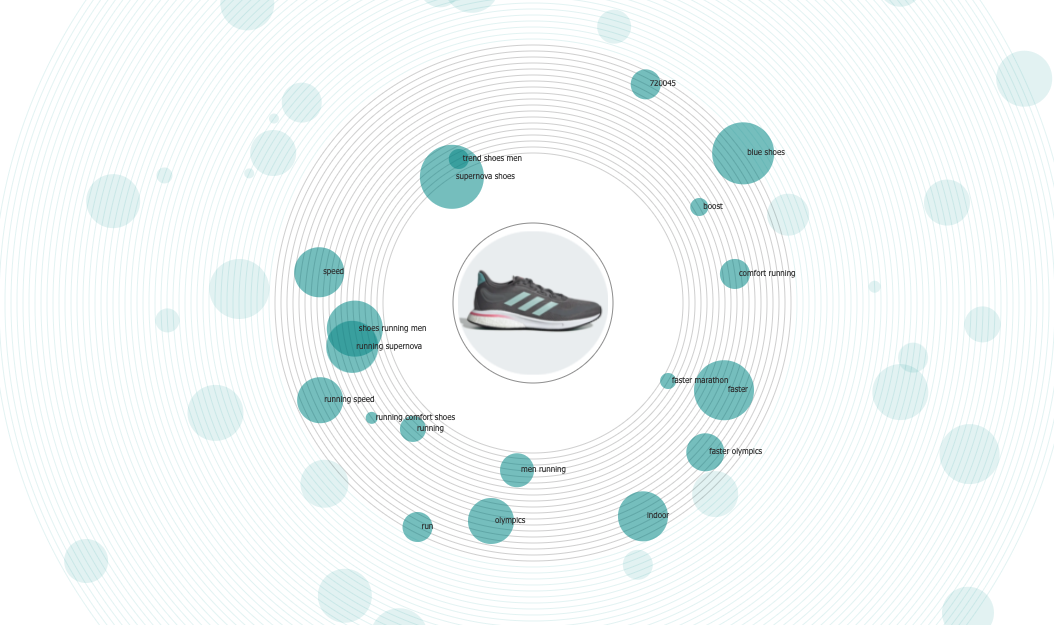
Following the idea of constellation, we could put the next queries orbiting around their queries. These, at the same time, orbit around a centre linked to the product. This solution allows space optimisation and the display of a high level of information at the same time.
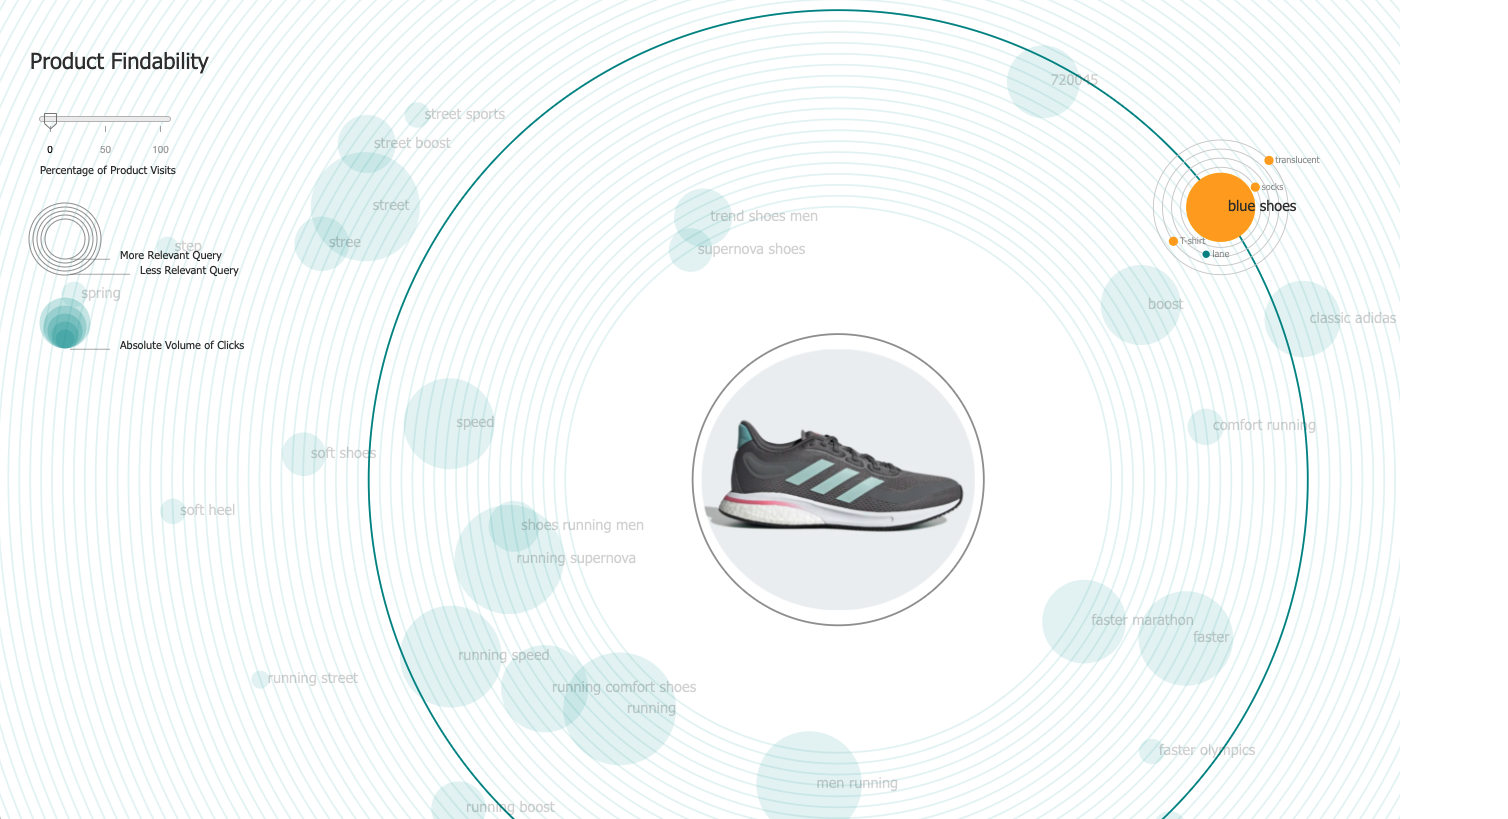
Case Study
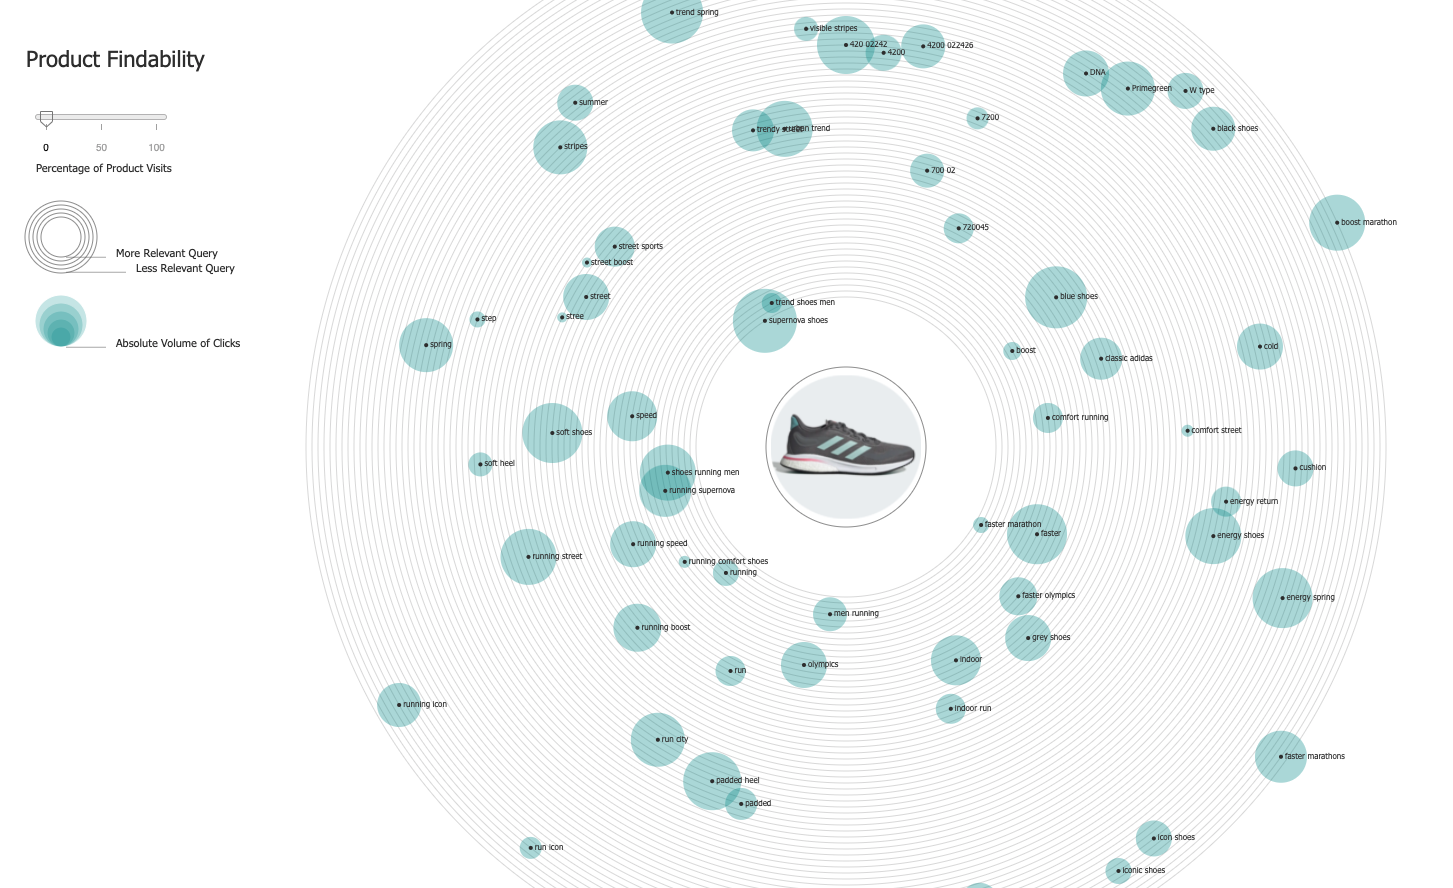
Now, let us consider an example that uses the Orbits layout to display a product, the queries that lead to that product, and the next queries related to these queries.
First, we distribute the queries orbiting around the product. We draw a circle at each position, showing the absolute volume of clicks each query has. This feature provides information on the popularity of the query in global terms.
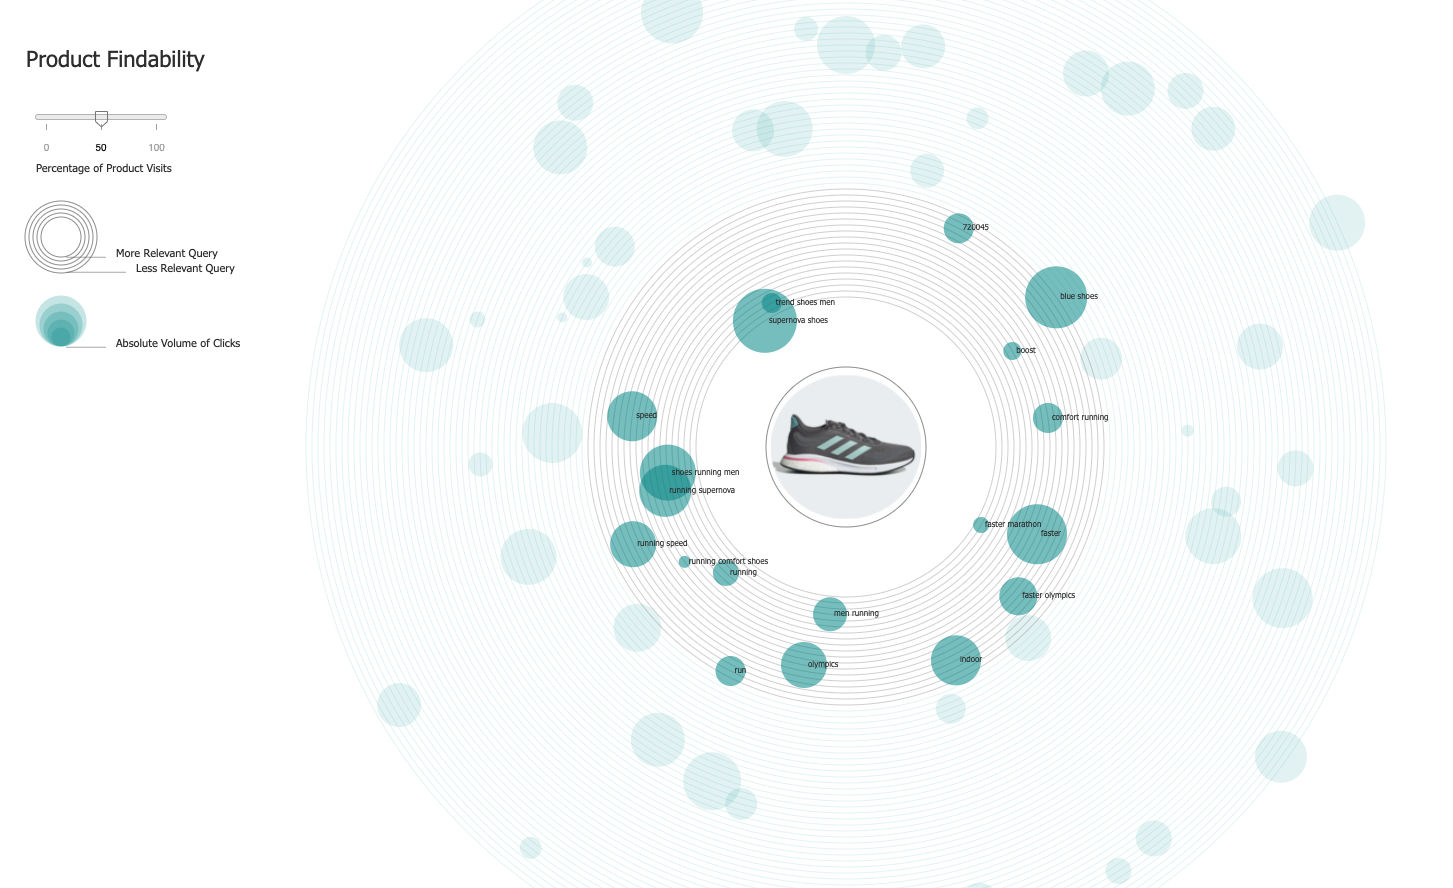
Then we apply a filter selecting those queries that contribute, for example, 50% of the total traffic leading to this specific product. As we can see, these queries are less than 50% of the total number of queries, meaning that just a small number of queries bear most of the traffic.
Once we have our selected queries, we hover over one specific query. The constellation of next queries appears. At this point, a few actions are enabled. These boost the query by creating a new Related Tag. Or, alternatively, boost the next query by creating a new next query related to the product.
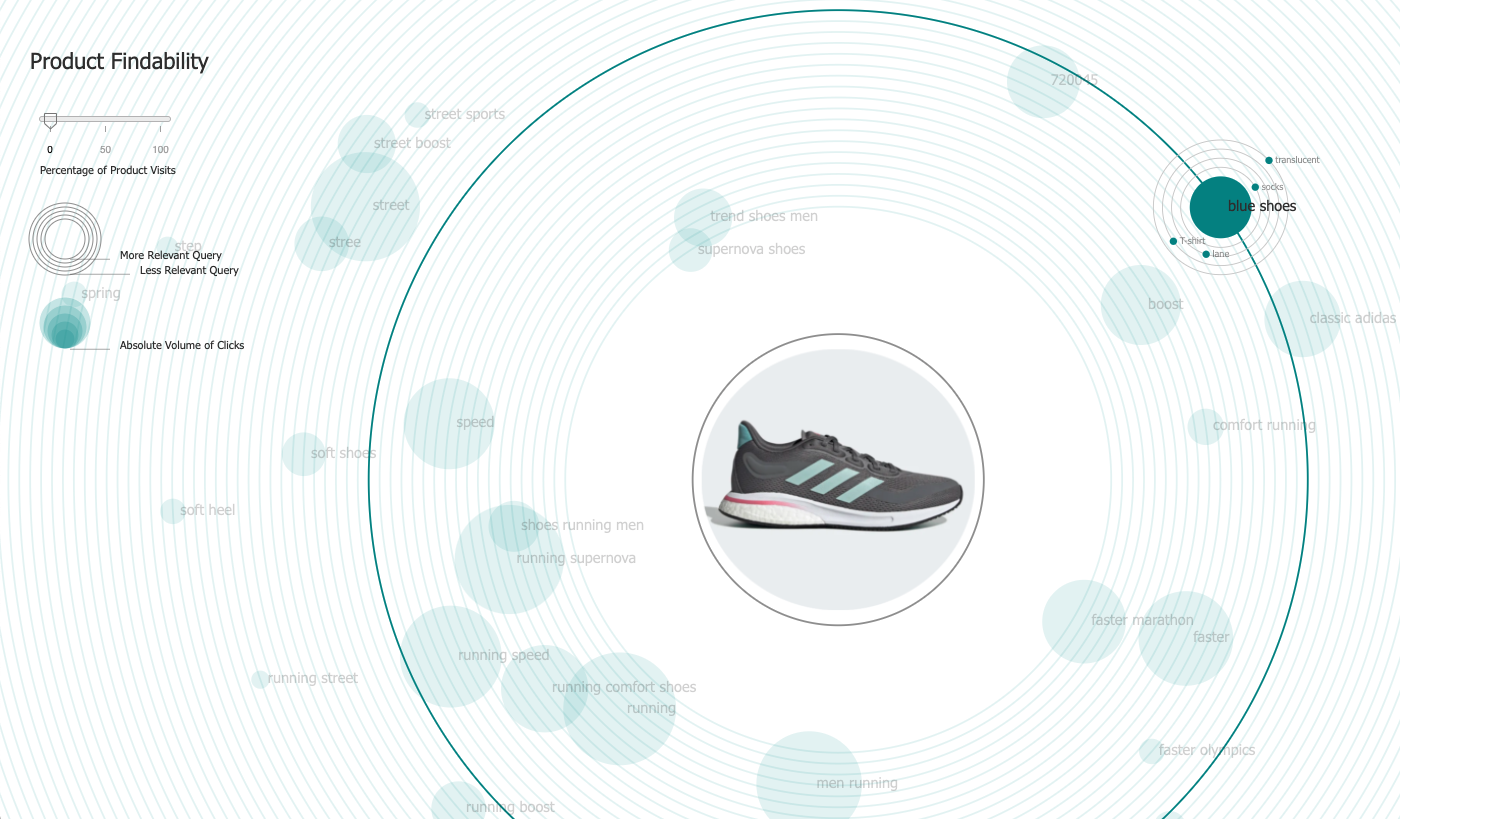
All the actions performed are labelled by changing the colour to keep track of them. This allows the user to continue exploring all the orbits and constellations, enhancing the paths that facilitate the process of reaching a product.
All in all, mapping all the available information and possibilities helps the user not only to have a comprehensive perspective on the current performance of a particular product, but also to take action. Data visualisation unleashes a plethora of graphical solutions to address these two issues now that search possibilities are endless. And constraining these limits is always a beautiful challenge
